Merchants often use performance tools to analyze their site’s page load time to get an understanding of their shopper’s experience. These tools may occasionally list Bolt as a significant contributor to JavaScript loading times. The following information is meant to help contextualize this perceived impact and assure you that Bolt is prioritizing, and will continue to prioritize, the speed of our services and the experience of your shoppers.
Bolt Script Sizes
| Script | Compressed Size |
|---|---|
account.js |
30kb |
connect.js |
80kb |
connect-bigcommerce |
250kb |
connect-shopify |
80kb |
embed.js |
40kb |
The Loading Sequence, Explained
This explanation is a simplified breakdown of how sites typically load Bolt. However, some commerce platforms or integration structures may change this exact sequence.
- The webpage loads and renders first.
- The Bolt scripts load after the webpage. This prevents script loading from delaying the page rendering.
- When prompted by the customer, Bolt Checkout opens. Because the script has been pre-loaded, prior to checkout, the customer will not experience a delay due to script loading.
Perceived Load Times vs Actual Shopper’s Experience
Performance tools provide insights into a site’s overall performance, but they do not convey the shopper’s dynamic experience of a site. Bolt’s javascript is loaded asynchronously, meaning that the javascript loads after the web page renders. Bolt’s scripts do not affect metrics such as First Contentful Paint or Largest Contentful Paint, key metrics for SEO and reduced friction.
You can review Bolt’s load times on your store, using a Chrome browser, by doing the following:
- Navigate to your storefront.
- Right-click the page and select Inspect.
- Navigate to the Network tab.
- Refresh the page to observe the asset loading for your page.
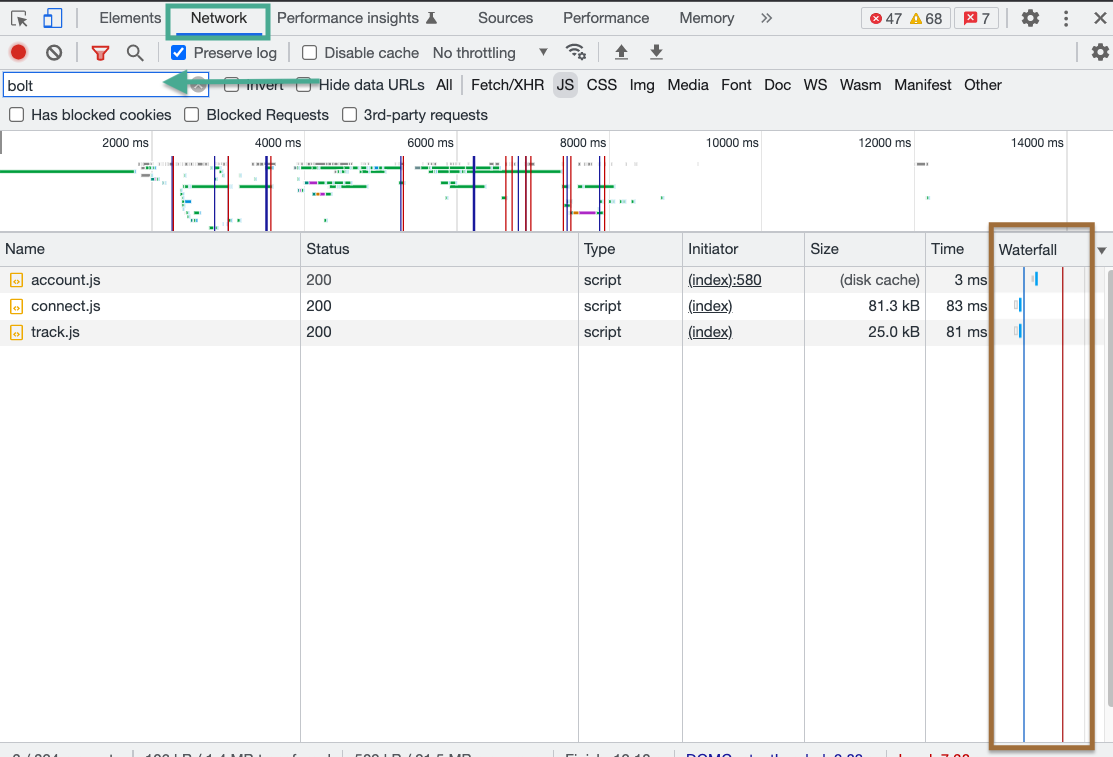
- Filter the network log with the word “bolt.”
- Review the Waterfall column.
- Blue Line: Browser has finished parsing the page
- Red Line: Browser has finished retrieving all resources required by the page
NOTE
Bolt’s assets typically do not come before more critical assets needed to parse the page, as they are closer to (or after) the blue line.
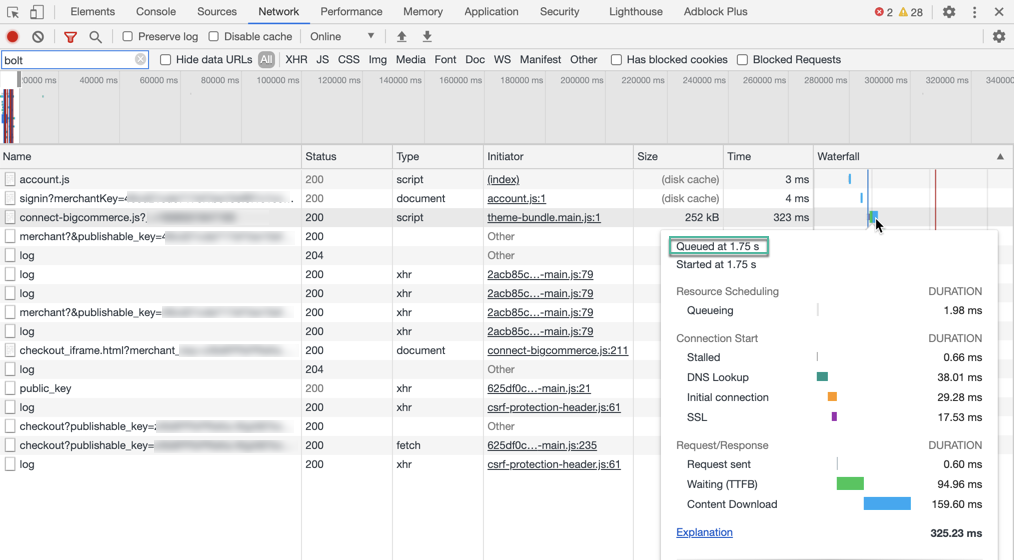
You can verify this more specifically by inspecting an asset’s waterfall time frame and checking when the item was queued. In the below example, Bolt’s connect.js script is not queued until after the first 1.75 seconds had passed – deferring priority to assets that directly impact shoppers.
Caching
Bolt uses industry-standard caching procedures. This means that components will be cached on the browser for subsequent page visits. This prevents the re-loading of scripts and components and thus avoids adding delays.